28
Mar

Technology Enabled Business Solutions
Comments: No Comments
Functionality: What does it do?
A dashboard is a tool used to quickly display and visualize data, typically using charts, tables, and other graphic elements. Dashboards provide a quick and simplified way for users to understand complex data sets, review key performance indicators (KPIs), and identify trends or patterns.
The data collected in most business processes—ranging from the outputs of an inspection form to the inputs into a companywide sales program—can be displayed in a dashboard. For example:
- Forklift Pre-Op Inspection Dashboard: A dashboard could be set up to track and visually display when the inspection form is being filled out, by whom, what types of issues are being identified, how frequently they are identified, and what outstanding issues need to be closed. These dashboards can help identify trends and improve overall management of the inspection program.
- Marketing and Sales Dashboard: Marketing and Sales departments rely heavily on metrics. Dashboards allow the end user to visualize data that is being tracked, such as advertising return on investment, engagement, growth, revenue, website traffic, sales pipeline, etc. These dashboards can help with sales forecasting and informing marketing decisions.
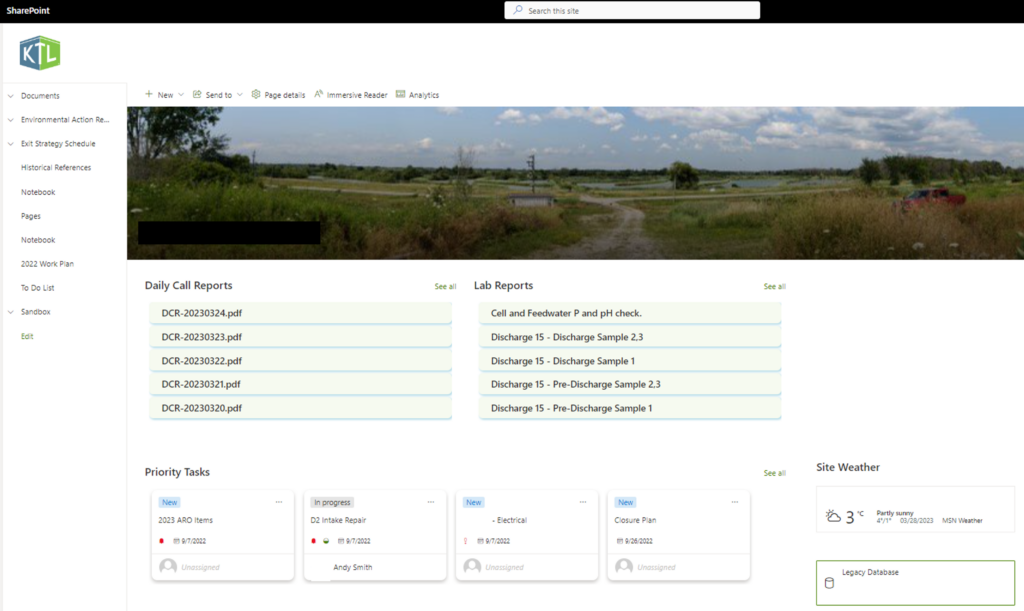
- Homepage Dashboard: Homepage dashboards are often used as internal landing pages that display important data related to the company and/or specific projects. These might be formatted to contain key metrics, important documents, sales data, assigned tasks, etc. They provide a quick, at-a-glance view of relevant data and information.
Benefits: Why do you need it?
- Dashboards provide an integrated view of data pulled from multiple sources into an easy-to-read display.
- Simplified data visualization allows for improved and more efficient decision-making.
- Dashboards metrics provide for real-time monitoring of data as it is being collected.
- The collaboration, customization, and transparency provided through dashboards help support organizational objectives.
Technology Used
- Excel
- Power Apps
- Power BI
- SharePoint