
OSHA: Using Drones for Inspections
What was once a very niche market, drones are emerging into an important new phase: everyday use of drone technology in the workplace. It’s no longer just tech-savvy companies that are using drones. Enterprise-level drone operations are becoming a big deal—and not just in industry. During 2018, the Occupational Safety and Health Administration (OSHA) reportedly used drones to conduct at least nine inspections of employer facilities.
OSHA’s drones were most frequently used following accidents at worksites that were considered too dangerous for OSHA inspectors to enter—a common and important benefit of the drone technology. However, is likely that OSHA’s use of drones will quickly expand to include more routine facility reviews, as drones have the ability to provide OSHA inspectors a detailed view of a facility, expanding the areas that can be easily viewed and reducing the time required to conduct an inspection on the ground.
Employers must currently grant OSHA permission to conduct facility inspections with drones, and there are many implications industry must consider in giving this permission. Read the full article in EHS Today to learn more.

How to Succeed with & Scale a Drone Program
Talk about starting an Unmanned Aerial System (UAS) (a/k/a “drone”) program is happening at companies of all sizes, but establishing the right foundations to ensure these kinds of programs don’t fail is far less pervasive. At DJI AirWorks 2018, Kestrel Consultant, Industrial UAS Programs, Rachel Mulholland’s presentation, “Bringing Your Drone Program to Scale: Lessons Learned from Going Big” laid out what it means to achieve success and avoid failure with the technology.
Commercial UAV News recently caught up with Rachel to further discuss her presentation, which focused on UAS applications for infrastructure, explored why UAS programs fail, and detailed the foundations of a successful drone program. In the published interview, she details some of her lessons learned from out in the field, what it means to deal with positive and negative assumptions people have about the technology, why it is so important to have a UAS Program Operations Manual, and much more.
Read the full interview in Commercial UAV News, and learn more about Kestrel’s UAS Program Management services.

Comments: No Comments
Kestrel to Present at AirWorks 2018
The AirWorks 2018 Conference is focused on the growing commercial drone industry and how developers, partners, and operators can work to reshape the global economy with drones. This year, Kestrel Management will be teaming with Union Pacific Railroad to talk about our experience and lessons learned from managing industrial-scale drone programs.
AirWorks 2018
October 30 – November 1, 2018
Dallas, Texas

Kestrel Presentation: Bringing Your Drone Program to Scale: Lessons Learned from Going Big
Thursday, November 1 at 11:00 a.m.
Rachel Mulholland, Kestrel Management Consultant, Industrial UAS Programs
Edward Adelman, Union Pacific Railroad, General Director of Safety
This presentation will discuss the risks and opportunities associated with building an industrial drone program and share some of the lessons learned from our experience. We’ll discuss common questions, including the following:
- What does it take to build an industrial drone program?
- How can UAS technology fit into your current business model?
- What challenges can occur with fleets of certified remote pilots and unmanned vehicles?
- How do you ensure you operate in compliance with FAA regulations?
- What are some common pitfalls to avoid and best practices to incorporate into your program?
Why You Should Attend
If you currently have a drone program or are looking to implement one, this event is for you!
- Attend sessions focused on the industry track most relevant to your business: construction, energy, agriculture, public safety, infrastructure
- Network with companies that are on the forefront of enterprise drone adoption
- Get a preview of the latest drone technologies
- Receive hands-on training from experienced industry leaders and instructors

NACD Responsible Distribution Cybersecurity Webinar
Join the National Association of Chemical Distributors (NACD) and Kestrel Principal Evan Fitzgerald for a free webinar on Responsible Distribution Code XIII. We will be taking a deeper dive into Code XIII.D., which focuses on cybersecurity and information. Find out ways to protect your company from this constantly evolving threat.
NACD Responsible Distribution Webinar
Code XIII & Cybersecurity Breaches
Thursday, September 20, 2018
12:00 -1:00 p.m. (EDT)

Integrating Technology into Traditional Processes
Traditional processes tend to produce traditional results. You can’t expect technological innovation without technological integration. The key is identifying the traditional processes that yield benefits (most likely cost or time savings) from technological integration. Doing this allows companies to stretch and empower every limited resource.
Fix It & Find It
Take the business practice of internal auditing as an example. The most traditional practice for internal auditing (e.g., environmental, safety, DOT compliance, ISO 9001, food safety) is a “find it & fix it” cycle, where the internal auditor goes out into a facility and audits operations as they exist. During the audit, the auditor identifies issues based on a standard set of protocols. The auditor typically walks a facility with a notepad and pencil taking notes of field observations that aren’t in compliance. Following the audit, the auditor creates a report and shares the findings with a responsible party. This can take weeks or even months. The cycle is repeated when the auditor comes back at a later time to check the site again.
The “find & fix” audit cycle works, but only to a point. The difficult part comes next. What happens with that inspection form or accident investigation report after it is completed? It is likely reviewed by a few people, perhaps transcribed into electronic form by a data entry clerk, and filed away someplace for legal and compliance reasons, rarely (if ever) to be seen again.
Filing data away in a drawer is better than nothing because it does show some documentation of findings, but that is where the benefits end. What happens when the auditor is asked to compile year-long data from the findings? How do you evaluate patterns and trends to best allocate your limited resources for improvement initiatives? The paper method of recordkeeping makes compiling field data into a report an enormous task.
Electronic Data Capture
If the auditor were to capture all the field data via smart phone or tablet at the point of discovery, the task of generating a report to analyze trends would be much easier. When data is collected, uploaded, and stored in a database, accessing and reporting on the data becomes as easy as asking a question. Questions like, “How many deficient issues were there at the warehouse last year?” or “How many overdue action items does Bruce have in repackaging?” can be answered by simply making a request of your data.
Data entered in the field can be used in many ways. Some applications written for devices allow you to print reports immediately from the smart phone and tablet device. Others require the data to first be uploaded to a desktop computer. Either way, the reports generated can include photos at the point of discovery and reference information, along with field comments. These reports support the auditor’s findings and remove questions about what was observed or whether a situation is in violation of the protocol. Subsequently, these reports also become a valuable learning tool for employees in the field.
Once uploaded, the data is stored in a database for later reference. Assessments continue to be added as audits are performed to amass a large bank of data. In electronic format, that data (unlike handwritten notes) can be easily arranged for analysis. Reports can be generated using a large menu of criteria, including running statistics on a site over a period time or identifying instances of a certain violation. Mining your data in different ways helps identify root causes and end harmful trends so that real improvement can occur.

Evolving Technology: A Relational Approach
Companies grasp the importance of using technology to create business efficiencies. Integrating technology into traditional processes allows companies to stretch and empower limited resources. It offers ways to provide more value to company operations and management systems.
Traditional Solutions
When it comes to technology integration, however, companies traditionally look for an isolated solution to a single problem—a find-it, fix-it approach. A simple example of this would be creating an Excel spreadsheet to manage data from multiple sources. While this creates an improvement beyond the traditional hard copy binder, it is a linear, isolated solution to one issue that offers minimal additional business value.
Consider the data on that spreadsheet and consider how business systems work. Does the data stand alone or does it impact other parts of the business? Does the business system operate in a silo or are there common elements with other business systems? In most cases, there is overlap between data, information, systems, platforms, etc. As a result, building a patchwork of technology solutions to address individual problems is only a short-term fix.
Relational Approach
Truly valuable technology solutions take a relational approach that considers the immediate issue within the context of the overall business need, and then integrates multiple platforms/systems, as required, into an aligned system.
A forward-thinking, relational technology approach takes a solution perspective that thinks beyond the singular project need to the big picture and then designs backward. It’s a shift in mindset from “How can I use technology to make this efficient?” to one that asks, “Ultimately, what does the big-picture, desired state look like…and how can technology get us there?”
A relational approach such as this follows these steps:
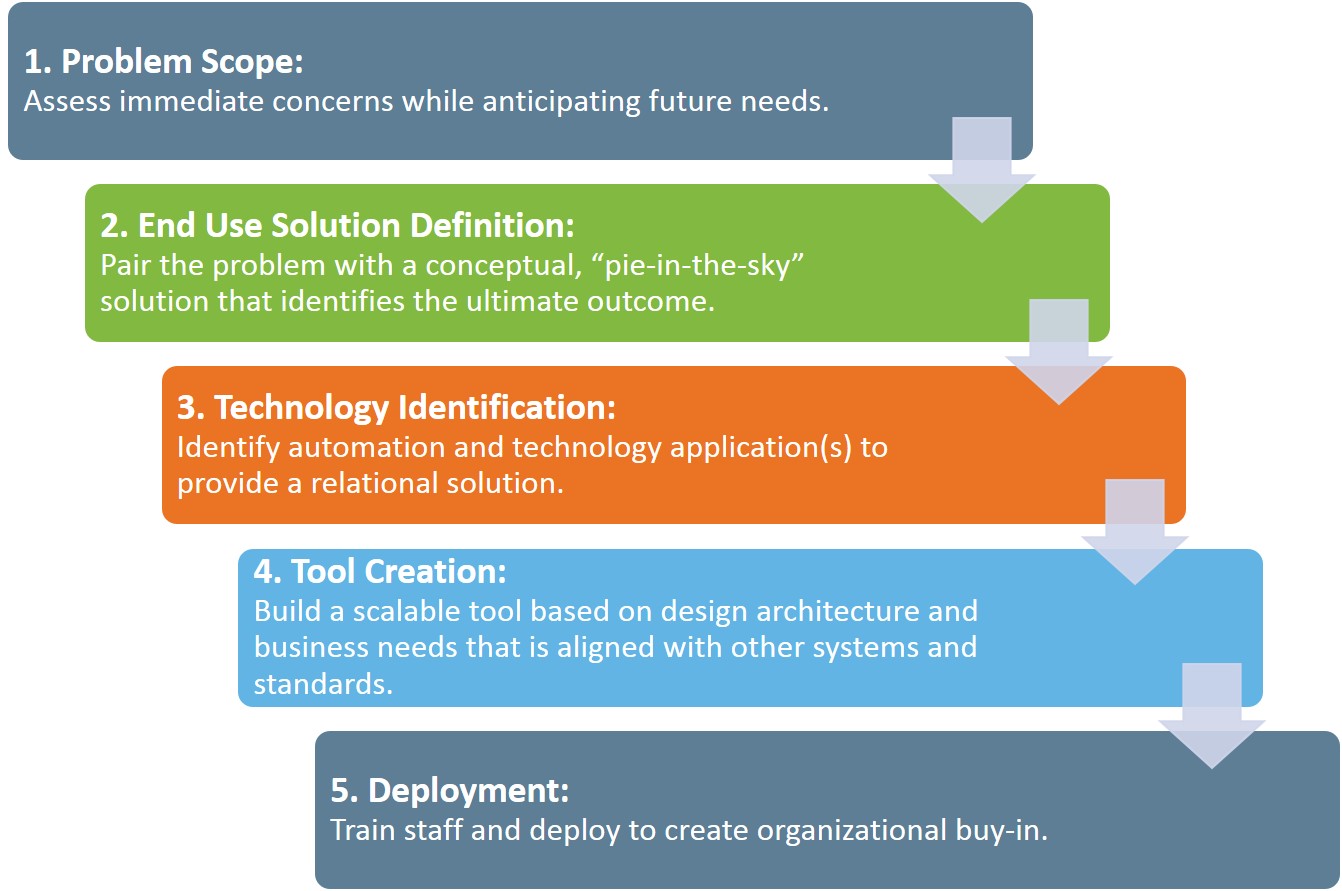
Case Study in Technology Integration
The following case study provides a real-world example of how a global chemical distributor is following these steps to create a relational technology solution that will improve business efficiencies across the company. Initially, this distributor wanted to pull data from facility reports for 150+ locations into one database—that was the “simple” problem. The old system had facilities entering data into Excel forms. That information was then pulled into Access so the data could be manipulated.
Understanding that the facility data is intertwined with many aspects of the business, Kestrel looked beyond this singular issue at the bigger picture. The forward-thinking solution would be to create a technology platform that would solve this facility data problem and could easily be expanded to other business needs, particularly since facility data is tied to most aspects of the business.
To do this, Kestrel built the facility form into SharePoint as the base application for the company’s overall system. SharePoint houses all data previously input into Excel documents for each facility broken up by 11 regional operating companies with multiple locations under each. The form requires that each facility contact fill out quarterly information on the facility (e.g., permits, fleets, transportation, personnel). Beyond the facility form, the SharePoint system currently has the following modules, which all feed into the facility form:
- Facility images
- Storage tanks
- Facility audits
- Sustainability
The SharePoint system is continuing to be expanded to integrate other systems into a single source that will create significant business efficiencies. This approach is creating many benefits across the company:
- The company is able to collect multiple levels of data and then associate that data to the individual facility or provide a composite report (i.e., data required for storage tanks, sustainability efforts, audits conducted).
- The look and feel of the forms in SharePoint are very similar to the original Excel documents, so it is an easy transition and very intuitive system to use. Little training has been required.
- The company can easily track information on all facilities. Management can export data to Excel and create reports. The company has complete ownership of data and deliverables.
- The system can create alerts for overdue items and generate real-time metrics and dashboards. Many additional options can be further customized based on ongoing business needs.
- Additional data from other systems being used across the company (e.g., auditing program) can be integrated and aligned into SharePoint as users become more familiar with the platform.
Why SharePoint?
SharePoint is a dynamic solution tool that can be customized and designed to capture data and provide consolidated reporting to all levels of management. Because of SharePoint’s flexibility, the possibilities of what it can do are virtually endless:
- Creates a single, familiar platform that simplifies access
- Provides functionality for continual adaptation to meet future data management and reporting needs
- Adapts to the needs of the business, rather than the business adapting to the capabilities of the program
- Maximizes efficiency and connectivity between many field and corporate groups
- Allows information to be shared and tracked in multiple ways
- Allows users to easily create complex databases that are both manageable and flexible
- Gives the ability to manage sites/facilities/plants/departments for compliance purposes
- Simplifies the data entry process by providing user-friendly functionality
- Consolidates reporting
- Provides a dynamic solution – updates made to the tool are reflected immediately
- Allows local users to control and build sites to their specifications
- Allows all levels of users to work with it easily due to its intuitive nature
By having so many features and applications on a single platform, it is easy to tie them all together into an aligned system and to create multiple functions/uses for the data being collected from so many sources. With an aligned system, then, achieving the big-picture, desired state (rather than the short-term fix) becomes entirely possible.

Environment / Food Safety / Quality / Safety / Technology Enabled Business Solutions
Comments: No Comments
Technology Tip: Software and Audits Top 10
All types of business and operational processes demand a variety of audits and inspections to evaluate compliance with standards—ranging from government regulations to industry codes, to system standards (i.e., ISO), to internal corporate requirements.
Audits provide an essential tool for improving and verifying compliance performance. Audits may be used to capture regulatory compliance status, management system conformance, adequacy of internal controls, potential risks, and best practices.
By combining effective auditing program design, standardized procedures, trained/knowledgeable auditors, and computerized systems and tools, companies are better able to capture and analyze audit data, and then use that information to improve business performance. Having auditing software of some sort can greatly streamline productivity and enhance quality, especially in industries with many compliance obligations.
The following tips can help ensure that companies are getting the most out of their auditing process:
- Have a computerized system. Any system is better than nothing; functional is more important than perfect. The key is to commit to a choice and move forward with it. Companies are beginning to recognize the pitfalls of “smart people” audits (i.e., an audit conducted by an expert + notebook with no protocols or systems). While expertise is valuable, this approach makes it difficult to compare facilities and results, is not replicable, and provides no assurance that everything has been reviewed. A defined system and protocol helps to avoid these pitfalls.
- Invest time before the audit. The most important time in the audit process is before the audit begins. Do not wait until the day before to prepare. There is value in knowing the scope of the audit, understanding expectations, and developing question sets/protocol. This is also the time to ensure that the system collects the data desired to produce the final report.
- Capture data. Data is tangible. You can count, sort, compare and organize data so it can be used on the back end. Data allows the company to produce reports, analytics, and standard metrics/key performance indicators.
- Don’t forget about information. Information is important, too. The information provides descriptions, directions, photos, etc. to support the data and paint a complete picture.
- Be timely. Reports must be timely to correct findings and demonstrate a sense of urgency. Reports serve as a permanent record and begin the process of remediation. The sooner they are produced, the sooner corrective actions begin.
- Note immediate fixes. During the audit, there may be small things uncovered that can be fixed immediately. These items need to be recorded even if they are fixed during the audit. Unrecorded items “never happened”. Correspondingly, it is important to build a culture where individuals are not punished for findings, as this can result in underreporting.
- Understand the audience. Who will be reading the final report? What do they need to know? What is their level of understanding? Not all data presentation is useful. In fact, poorly presented data can be confusing and cause inaction. It is important to identify key data, reports desired, and the ways in which outputs can be automated to generate meaningful information.
- Compare to previous audits. The only way to get an accurate comparison is if audits have a common scope and a common checklist/protocol. Using a computerized system can ensure that these factors remain consistent. Comparisons reinforce and support a company’s efforts to maintain and improve compliance over time.
- Manage regulatory updates. It is important to maintain a connection to past audits and the associated compliance requirements at the time of the audit. Regulations might change and that needs to be tracked. Checklists, however, may remain the same. Companies should have a process for tracking regulatory updates and making sure that the system is updated appropriately.
- Maintain data frequency. For data, the frequency is key. Consider what smaller scope, higher frequency audits look like. These can allow the company to gather more data, involve more people, and improve the overall quality and reliability of reports.
A well-designed and well-executed auditing program—with analysis of audit data—provides an essential tool for improving and verifying business performance. Audits capture regulatory compliance status, management system conformance, adequacy of internal controls, potential risks, and best practices. And using a technology tool or system to manage the audit makes that information even more useful.

Case Study: Efficient Compliance Management
Regulatory enforcement, customer and supply chain audits, and internal risk management initiatives are all driving requirements for managing regulatory obligations. Many companies—especially those that are not large enough for a dedicated team of full-time EHS&S staff—struggle with how to effectively resource their regulatory compliance needs.
The following case study talks about how The C.I. Thornburg Co., Inc. (C.I. Thornburg) is using a technology tool to efficiently meet National Association of Chemical Distributors (NACD) and a number of other regulatory requirements.
The Challenge of Compliance
C.I. Thornburg joined NACD in January 2015. As a condition of membership, the company started the process of developing and implementing Responsible Distribution in April 2015. Responsible Distribution showcases member companies’ commitment to continuous improvement in every business process of chemical distribution—and it requires rigorous management activities to develop and maintain.
With an EHS&S department of one, managing all of those activities was a challenge for C.I. Thornburg. The company was looking for a way to streamline the process and more effectively manage Responsible Distribution requirements and regulatory compliance obligations.
Code & Compliance Elite™
C.I. Thornburg brought on Kestrel to initially help the company achieve Responsible Distribution verification. Kestrel worked with C.I. Thornburg to customize and implement Code & Compliance Elite (CCE™), an easy-to-use technology tool designed to effectively manage management system and verification requirements. Kestrel tailored the CCE™ application specifically for C.I. Thornburg to provide:
- Document management – storage, access, and version control
- Mobile device access
- Regulatory compliance management and compliance obligation calendaring
- Internal audit capabilities
- Corrective and preventive action (CAPA/CPAR) tracking and management
- Task and action management
CCE™ played a large role toward the end of C.I. Thornburg’s Responsible Distribution implementation, particularly with document control and organization, and in the verification audit. During verification, documents could be quickly referenced because of how they are organized in CCE™, making the process very efficient. According to C.I. Thornburg Director of Regulatory Compliance and EHS&S Richard Parks, “The verifier was blown away by how well we were organized and how the tool linked many documents from different regulatory policies.” The company achieved verification in May 2016.
Broadening to Other Regulatory Requirements
CCE™ is still being used to manage Responsible Distribution requirements, but C.I. Thornburg is now working with Kestrel to expand it to all regulatory branches that govern the business. Regulatory requirements function similarly—for example, Responsible Distribution has 13 codes, Department of Homeland Security (DHS) has 18 performance standards (RBPS), and OSHA PSM has 14 elements. All require internal audits and corrective action tracking—things that can be easily and effectively managed through CCE™ to create a one-stop shop for regulatory compliance. Kestrel is currently developing the DHS and PSM modules in CCE™ for C.I. Thornburg.
Valuable Management Tool
CCE™ is providing C.I. Thornburg with a valuable management tool that automates the regulatory landscape. According to Parks, as a small organization that depends on using efficient tools to manage compliance rather than adding more manpower, CCE™ has provided huge cost savings and tremendous value for the organization, including the following:
- CCE™ has become the ultimate tool inefficiency. Tasks that used to take hours to complete are now easily done in just minutes.
- The internal audit function of CCE™ makes audits seamless and tracking and follow-up easy.
- The CAPA tool ensures that the company is managing corrective actions and completing follow-up activities and tasks.
- The functionality of CCE™ allows for managing multiple regulatory dashboards, providing a one-stop shop for managing regulatory compliance obligations.
- CCE™ creates an organized document structure that enables easy access to information and quick response to auditors.
- During Senior Management Review, senior managers see the benefit of being able to reference the history of corrective actions and audits through CCE™.
“A lot of NACD member companies are small organizations that have limited resources to effectively manage all EHS&S needs,” said Parks. “CCE™ really creates the department and is a huge value to small businesses. With the CCE™ technology and a company’s clearly defined goal, Kestrel can provide an efficient solution to most any need.”

Pull vs. Push Reporting: Leading KPI Development
Key performance indicator (KPI) is, arguably, one of the biggest buzzwords of the decade. If you want someone’s attention, mention KPIs. According to Investopedia, KPIs are “a set of quantifiable measures that a company or industry uses to gauge or compare performance in terms of meeting their strategic and operational goals.”
For some individual practices—financials, inventory, sales—KPIs are relatively standard. For example, a company may measure revenue growth year after year as a standard KPI. As we bridge into operational practices with varying numbers of employees and levels of risk, however, it can become more difficult to understand not only how to establish KPIs but also where to get the data.
Technology can help to create a pull-to-push methodology that puts site-specific leading KPIs at stakeholders’ fingertips.
Leading vs. Lagging Indicators
In order to understand how to use this pull-to-push methodology to create leading KPIs, it is important to first understand the concept of leading versus lagging indicators.
- Lagging indicators measure and help track how the company is performing in comparison to its goals. Lagging indicators are usually fairly easy to measure—but they can be hard to influence because what they are measuring has already happened or performance data already captured. In this way, lagging indicators are backward-focused. Many standard performance metrics are lagging. In safety, for example, the Recordable Incident Rate is a lagging indicator. Important information to know but hard to change.
- Leading indicators signify the direction performance is going. Because leading indicators come before a trend, they are often seen as business drivers and should be incorporated into the business strategy. The forward-looking nature of leading indicators may make them harder to measure and they may change quickly; however, leading indicators are generally easier to influence. A good example of a leading indicator in determining the most common causes of an incident before it happens to prevent future recurrence, thereby impacting performance.
Pull vs. Push Metrics
That brings us back to the pull-to-push methodology. Or, in essence, digging for metrics versus having KPIs sent directly to the appropriate stakeholders.
With a push approach, metrics are literally “pushed” to end-users, who then extract meaningful insights and take appropriate actions for themselves. Push metrics can have a number of components that trigger when (and who) metrics are sent to, including threshold, capacity, severity, and timing.
Conversely, with a pull approach, data is pulled in order to answer specific business questions. Pull metrics generally require someone with analytical skills to dig deeper into the data to identify the desired metrics.
While pull metrics may be more time consuming to identify and obtain, that doesn’t mean pull metrics aren’t important to have. In fact, organizations often need to pull data in order to create the push metrics that provide for standard KPIs. And push metrics may demand you circle back and pull further information. In reality, the process is cyclical: pull produces what should be pushed; push cycles back to pull in order to dig deeper into the details.
Creating Standard KPIs
How does an organization, then, get to the point of having standard KPIs that can be pushed when needed and that don’t require the time and investment associated with digging for information?
Technology can help to create that pull-to-push methodology for creating standard KPIs. This requires a number of things:
- The program must be well-established and designed with the operational requirements, capacity, tools, and skills to effectively integrate the program itself and associated data with technology.
- Assuming a program such as this is developed, initial reports can be pulled to check the program’s effectiveness based on a number of key attributes/metrics. This yields analyzable data.
- This data should be explored in many different ways. This allows the company to start seeing the interaction between stakeholders and the data and, eventually, creates the “a-ha” moment of understanding as to what metrics are important and meaningful.
- At this point, it becomes possible to begin comparing data and metrics on a periodic basis, while continuing to pull information from technology. Remembering what queries are effective will aid in establishing initial leading KPIs. This process also will yield improved understanding of how the data gathering process (e.g., incident investigation) needs to be improved and standardized for a more reliable pull of information.
- This comparison of data should then be used to discover what data is beneficial and what information needs to be more granular to really hone in on the standard KPI.
Walking through this process and leveraging available technology makes it possible to effectively transition from pull methodology to push reporting—putting leading KPIs in the hands of decision-makers and identified stakeholders.

Relational Databases: Keeping Up with Operations
In simplest terms, a “database” is a collection of records. To many, databases are simply a technological representation of linear tasks that provide the benefits of electronic storage, security, time savings, etc. Linear databases basically replicate a standard file folder structure that we are familiar with when working in a program like Windows Explorer. These are all great benefits to any organization.
As our desire and ability to access information has changed, however, the linear database model has its shortcomings.
The Birth of Relational Databases
Databases really began to evolve and provide the ability to extract desired information with the birth of the relational database model, as first proposed by E.F. Codd in 1970.
A relational database stores records according to how they relate to each other, making it multi-dimensional. With a relational database, you can quickly compare information because of the arrangement of data. Using the relationship of similar data increases the speed and versatility of the database.
The benefits of a relational database become very apparent when applied on a larger scale. Take Amazon as a prime example of a relational database. If you were buying socks from Amazon, sorting through a linear file structure to find the pair you want would take an exceedingly long time. There would be folders filled with different options based on size, color, pattern, etc. With a relational database, you are able to search on multiple dimensions and effectively filter your results. Relational databases help the user find what they want and the owner better understands user behavior.
Keeping Up with Operational Tempo
As relational database technology is being applied more and more in every facet of life, the expectation for all software to perform as a relational database is starting to overstep most current business practices and legacy IT systems.
The majority of business applications fall into a linear (i.e., folder, Excel spreadsheet) system because this is easily understood. In essence, these linear systems are an electronic replication of the typical management system three-ring binder. Pertinent information is there but is not easily usable. Unfortunately, systems such as these don’t often align with operational tempo, which, in reality, requires a relational model to create better access and utilization, as well as ease of use.
Case Study: Code &Compliance Elite
Code & Compliance Elite (CCE) is one example of a relational database that Kestrel recently developed and is deploying to help chemical distributors meet and manage Responsible Distribution management system requirements. The Responsible Distribution Codes of Management Practice, compliance programs, and related documents are all housed in CCE to allow for efficient tracking and documentation.
To enable ongoing compliance management, Kestrel also develops and maintains a number of tools tailored to Responsible Distribution in CCE, including:
- Document management – storage, access, and control
- Internal audit
- Corrective and Preventive Action (CPAR/CAPA)
- Task and action management
CCE employs a relational database structure with linear attributes (such as folders), where necessary. Even these folders, however, link to associated documents and owners to connect all applicable parts and procedures without requiring the user to dig through files.
Understanding and being able to evaluate components of an existing management system is key to extracting those pieces that lend themselves to relational use. When companies are able to do this, the end product is an operational management system that integrates technology with operations and meets the operational tempo of the business.